pong
The 101pong project
I assume you have already read the PDF at least once. If you haven’t, I encourage you to do so.
What is the project asking us? It is hard to understand and visualize. You will get used to that, it’s a trademark of Epitech’s PDFs.
To help with this visualization, I made a simple Desmos visualization for you to play around with the examples of the PDFs. If it appears as a black screen, try another browser.
I recommend you have it open on the side while you read this, as a big part of this project is movement, and it is quite tricky to deal with that in a static document. In any case, this is our starting point.

What you can see on the image is what the project is about. You have a plane (or paddle) that extends endlessly along the X and Y axis, that is why it is called plane $Oxy$. The two spheres are the point $t - 1$ and $t$, colored as red and blue respectively. If you don’t really know what $t - 1$ and $t$ represent, think of it this way. $t - 1$ is one second ago, and $t$ is now.
Which means that, we know the position of the ball one second ago, and the position of the ball now, from that we can figure out the velocity of the ball (in other words, how much does it move for each second, or using the project’s notation, for each $t$, and at what position it would be at the received time shift $n$).
The other part of the project, and the slightly more complicated one, is calculating the bounce angle. If the ball would hit the paddle, we need to know at what angle would it hit.
This is a bit weird, but here is the summary of what we need to calculate:
- The velocity of the ball.
- The position of the ball after $n$ ticks (ignoring the paddle, the ball goes THROUGH the paddle).
- The angle the ball would hit the paddle if it were to contact with it.
Now, this is as much of an explanation I will give you about the requirements of the project themselves. Now, let’s talk vectors, angles and points, and how they relate to the project.
Vectors
A quantity with a magnitude (a non-negative number) and a direction is called a vector $\vec{v}$. We tend to refer to numbers as scalars, to differentiate them from vectors.
Vectors tend to be visualized with arrows.
(Export your CeTZ vector grid here and save as /assets/vector_graph_1.svg)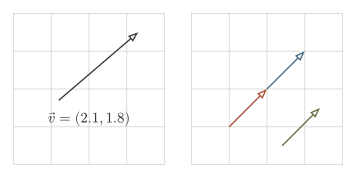
This is the definition of a vector, and you’re going to read this about virtually everywhere you try to find information about vectors. While true, it uses words a bit too big for my not-so-big brain.
A vector is basically “strength + direction” (like a push or a jump).
So when you write a vector as $\vec{v} = (3, 1)$, think: “we go $3$ along the $x$ direction, and $1$ along the $y$ direction.”
And it does not matter where we put the arrow (floor, table, whatever). If it has the same direction and the same strength, it’s the same vector.
(Export your CeTZ vector graph here and save as /assets/vector_graph_2.svg)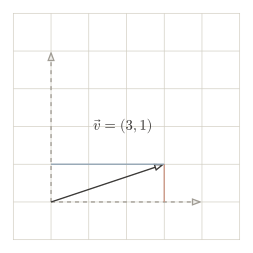
Great! We have the first part of the vector covered. But, what about the magnitude? The magnitude is the “strength” or “intensity” of the vector?
$$||\vec{v}|| = \sqrt{x^2 + y^2}$$In our example:
$$||\vec{v}|| = \sqrt{3^2 + 1^2} = \sqrt{10} \approx 3.1623$$This just happens to be the same way we would calculate the length of our arrow.
(Export your CeTZ hypotenuse graph here and save as /assets/vector_graph_3.svg)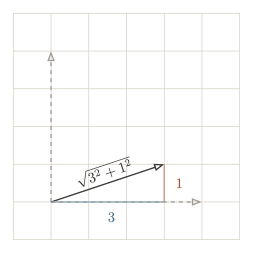
This may create a question. Are the magnitude and the length of a vector, the same thing? Almost, but no. Every single vector has a magnitude, as stated by the definition of the vector (remember, magnitude and direction), but only some of the vectors have a length.
The magnitude is a physical quantity, and the length is a graphical representation. Let’s look at an example.
We may have a distance vector, between two points on Earth. Let’s say its magnitude is 1000 km. If we visualize this arrow, it will have a length of 1000 km. What if we have a velocity vector? How long is velocity? You know its “intensity” (the magnitude, for example, 32 m/s).
I think this forum thread can provide a better explanation. I handpicked two different answers, but I recommend you to read all of them if you have the time:
https://physics.stackexchange.com/a/773048 https://physics.stackexchange.com/a/773054
Scalars
The final part of the definition, mentioned scalars. Good news for your probably tired brain, scalars are just individual numbers. Called like that because they scale the vector.
(Export your CeTZ scalar graph here and save as /assets/vector_graph_4.svg)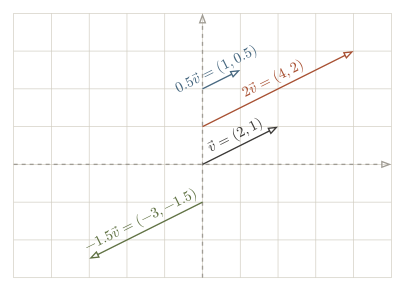
As you can see, the scalar just multiplies the $x$ and $y$ components of the vector ($(a x, a y)$). The vector $2 \vec{v}$ is exactly twice as long as $\vec{v}$, and the vector $-1.5 \vec{v}$ is one and a half times as long, but pointing in the complete opposite direction. For division, simply remember that $a / 2 = 0.5a$.
Vector Addition
Another important operation with vectors is addition (and subtraction). It’s far from complicated, we simply do $(x_1 + x_2, y_1 + y_2)$. Here you have a visualization on why that is the way it is.
(Export your CeTZ vector addition graph here and save as /assets/vector_graph_5.svg)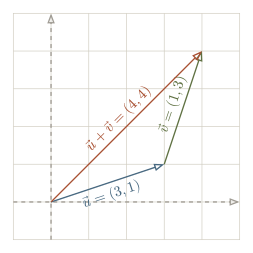
To add two vectors graphically, you simply take the second vector and place its tail at the tip of the first vector. The resulting vector is the straight line from the start of the first vector to the end of the second!
You’re just adding the $x$ values together, and the $y$ values together.
$$(3, 1) + (1, 3) = (3 + 1, 1 + 3) = (4, 4)$$The Dot Product
While adding two vectors gives you a new vector, the dot product gives you a single number (a scalar). It is a way to measure how much two vectors “point in the same direction.”
(Export your CeTZ dot product graph here and save as /assets/vector_graph_6.svg)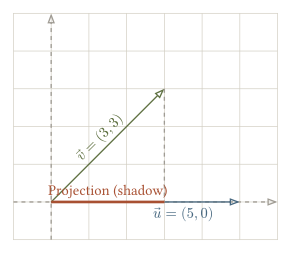
Visually, imagine shining a light straight down from the top of the green vector $\vec{v}$. The red line is its “shadow” cast onto the blue vector $\vec{u}$ (the tail of the blue vector is at $(0, 0)$). The dot product is closely related to the length of this shadow.
If the two vectors were pointing in completely opposite directions, the dot product would be negative. If they were perfectly perpendicular (at a $90^{\circ}$ angle to each other), the green vector would cast no shadow at all, and the dot product would be exactly $0$. This makes the dot product incredibly useful for calculating angles.
Calculating it is very straightforward. You just multiply their $x$ components, multiply their $y$ components, and add the two results together:
$$\vec{u} \cdot \vec{v} = (x_u \times x_v) + (y_u \times y_v)$$In our example from the graph:
$$(5, 0) \cdot (3, 3) = (5 \times 3) + (0 \times 3) = 15 + 0 = 15$$The Angle Between Two Vectors
Now that we know how to calculate the magnitude (length) of a vector and the dot product, finding the angle between two vectors is just putting those two pieces together.
In mathematics, angles are often represented by the Greek letter theta ($\theta$).
(Export your CeTZ angle graph here and save as /assets/vector_graph_7.svg)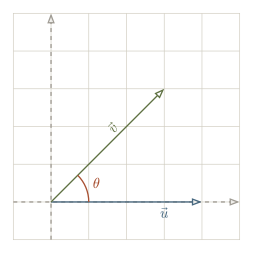
To find this angle, there is a standard formula that connects the dot product to the cosine of the angle:
$$\cos(\theta) = \frac{\vec{u} \cdot \vec{v}}{||\vec{u}|| \times ||\vec{v}||}$$In plain English: The cosine of the angle is equal to the dot product of the two vectors divided by their magnitudes multiplied together.
But we don’t want the cosine of the angle, we want the angle itself! To undo a cosine, we use the inverse cosine function, usually called arc-cosine. In programming (like in C’s <math.h>), this function is called acos().
If you don’t really understand this explanation, take a look at section 6.3 of this website:
https://people.math.harvard.edu/~jjchen/math21a/handouts/vector-ops.html#subsection-15
When you use acos() in almost any programming language, the result it gives you is in radians, not degrees! If you don’t really know what the cosine, arc-cosine or radians are, keep reading, you’ll find explanations after the conclusion. But that is not really required for the project.
Conclusion
I hope you are now aware of what vectors are and how do they relate to the project. If you believe you have some unanswered questions, or that you don’t really know how to apply some of these concepts to the project, it is something quite common. However, I want to think that this has provided you a starting point.
Thanks for reading.
A Quick Introduction to Trigonometry
Trigonometry sounds intimidating, but at its core, it is simply the study of triangles, right-angled triangles specifically. It gives us the tools to figure out unknown side lengths or angles if we only have partial information.
(Export your CeTZ triangle graph here and save as /assets/vector_graph_8.svg)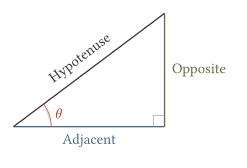
When looking at a right triangle from the perspective of an angle (our $\theta$), the three sides have specific names:
- Hypotenuse: The longest side, always opposite the 90-degree angle.
- Opposite: The side directly across from our angle $\theta$.
- Adjacent: The side next to our angle $\theta$ (that is not the hypotenuse).
The Three Main Functions (SOH CAH TOA)
Trigonometric functions are just ratios between two of these sides. The three most common ones are Sine (sin), Cosine (cos), and Tangent (tan). A famous and extremely helpful memory trick is SOH CAH TOA, which you’re going to read everywhere:
- SOH: $\sin(\theta) = \text{Opposite} / \text{Hypotenuse}$
- CAH: $\cos(\theta) = \text{Adjacent} / \text{Hypotenuse}$
- TOA: $\tan(\theta) = \text{Opposite} / \text{Adjacent}$
Why does this matter for vectors? Because if you have an angle and a magnitude (the hypotenuse), you can use these functions to find the exact $x$ (adjacent) and $y$ (opposite) components of a vector!
What are these functions, really?
When we say these functions are ratios, we mean they are just a division of two lengths.
Imagine a right triangle with an angle of $30^{\circ}$. No matter how huge or tiny you draw that triangle, whether the hypotenuse is 2 centimeters or 200 kilometers, if you divide the length of its Opposite side by the length of its Hypotenuse, you will always get $0.5$. That is a universal truth of geometry.
Because scaling a triangle doesn’t change its angles, the proportions between its sides always remain constant. Instead of calculating these proportions by hand every time, mathematicians created lookup tables (which are now built into your calculator and the <math.h> library) called Sine, Cosine, and Tangent.
To see how this perfectly ties into vectors, mathematicians like to use a Unit Circle, a circle with a radius of exactly $1$.
(Export your CeTZ unit circle graph here and save as /assets/vector_graph_9.svg)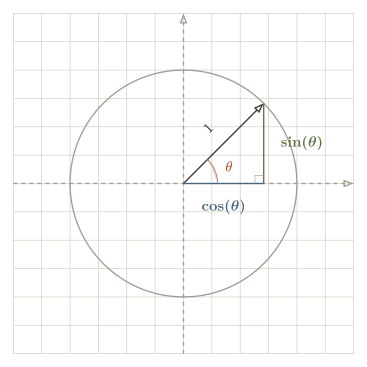
Look at what happens when our hypotenuse is exactly $1$. Let’s apply SOH CAH TOA:
- $\cos(\theta) = \text{Adjacent} / 1$
- $\sin(\theta) = \text{Opposite} / 1$
Because dividing by $1$ does nothing, this reveals a beautiful secret: on a unit circle, Cosine is just the X coordinate, and Sine is just the Y coordinate of your vector! Tangent, on the other hand, is the ratio of Sine divided by Cosine ($y / x$), which gives you the slope of that line.
The “Undo” Functions (Inverse Trigonometry)
We talked about sin, cos, and tan, which take an angle and give you a ratio (or coordinate). But what if you already have the coordinates (like you do in 101pong) and need to find the angle?
You use the inverse functions: Arc-sine (asin), Arc-cosine (acos), and Arc-tangent (atan).
Think of them as the “undo” buttons. If you know that $\cos(\theta) = 0.5$, then you can ask your program to calculate $\arccos(0.5)$, and it will hand you back $\theta$. This is exactly what we did in the previous section to find the angle between two vectors!
Degrees vs. Radians
In daily life, we measure angles in degrees, where a full circle is $360^{\circ}$. This is an arbitrary number humans invented a long time ago.
Mathematics and computers prefer a unit called radians. A radian is physically based on the radius of a circle. Instead of 360, a full circle is exactly $2\pi$ radians (roughly $6.28$). A half-circle ($180^{\circ}$) is exactly $\pi$ radians.
As mentioned in the previous section, when you use math functions in programming languages like C (sin(), cos(), acos()), they always expect and return radians.
To easily swap between them, keep these two formulas in mind (although if you’re using a high level language, there are functions for that. In Python, for example, you have math.radians() and math.degrees()):
- Degrees to Radians: $\text{Radians} = \text{Degrees} \times (\pi / 180)$
- Radians to Degrees: $\text{Degrees} = \text{Radians} \times (180 / \pi)$